AI
SRE
What we learned benchmarking 14 LLMs as SRE agents
Five of the eight models that ran our full benchmark solved 95-100% of their runs. What ended up separating them was the cost of a correct answer, the way they failed, and which provider was serving the weights when using open-weight models.

In July 2026 we ran the same test on 14 large language models. Each one drove our SRE agent against seven live Kubernetes clusters, climbing the same ladder of investigation tasks. Every task was repeated 3 to 6 times and scored on seven dimensions.
This was written to be an experience report, not a hard benchmarking test. In that regard, we don’t seek to present a definitive ranking here, but rather a helpful list of findings to assist you when doing your own research, or evaluating other’s.
The most important result was not a clear “winner”. Of the eight models that ran the full ladder, five solved 95-100% of their runs, so on raw correctness the top of the market has converged. The main differentiators we found were:
A correct answer cost 2.5x more from one model than from another.
Models fell short in different ways: one dropped clusters from its answers, another sometimes delivered no answer.
One model swung from excellent to unusable depending on which company was serving identical weights.
Outside the top five, one model invented a root cause when its tool calls failed. That alone keeps a model off the list we recommend to customers.
This post is organized around these patterns, because we expect them to hold for whatever models replace the ones we tested.
Why we test LLMs as agents
Hyground is an AI SRE agent that runs in the customer’s own Kubernetes cluster, and the customer picks the LLM that drives it: either a frontier model from one of the big labs, or open weights they serve themselves or through another provider. The model is configuration, and customers depend on that configuration being a good choice.
In an agentic system, the model makes the agent’s decisions: which tools to call, what to do when a call fails or comes back empty, what to assert about production systems. If the model decides wrong, the agent answers wrong, and there is no layer underneath that catches it. The wrong answer goes straight to the engineer, and a few of those are enough to lose their trust in the agent.
Typical coding benchmarks measure none of this. They score isolated tasks with a known answer, not investigations conducted with real tools against real infrastructure. We wrote previously about how observation is not diagnosis; the same gap appears in evaluation. A model that writes clean code can still be hopeless at deciding which of eleven tools to use on its twenty-seventh call.
So before we recommend any model to our customers, we test it on the literal job it will be used for.
How we tested
The task. The agent’s job is investigation: query live systems through tools, gather evidence across many clusters, hold it all in context, and produce one answer that is correct, grounded in what the tools actually returned, and covering every cluster.
The ladder. The tasks then form a complexity ladder. It starts with questions any on-call engineer asks in their first minute, like “which pods are in CrashLoopBackOff”, and climbs through inventory and trend analysis to multi-source root-cause investigations where the model must correlate metrics, restarts and events. Sometimes the correct answer is that nothing is actually wrong, and a model that always turns up something anyway is obviously not a good investigator.
The environment. Seven live clusters across AKS, GKE, EKS, STACKIT SKE, and two local machines. An LLM judge scored each answer against per-task expectations. Whenever a number surprised us, we went back to the raw run records by hand.
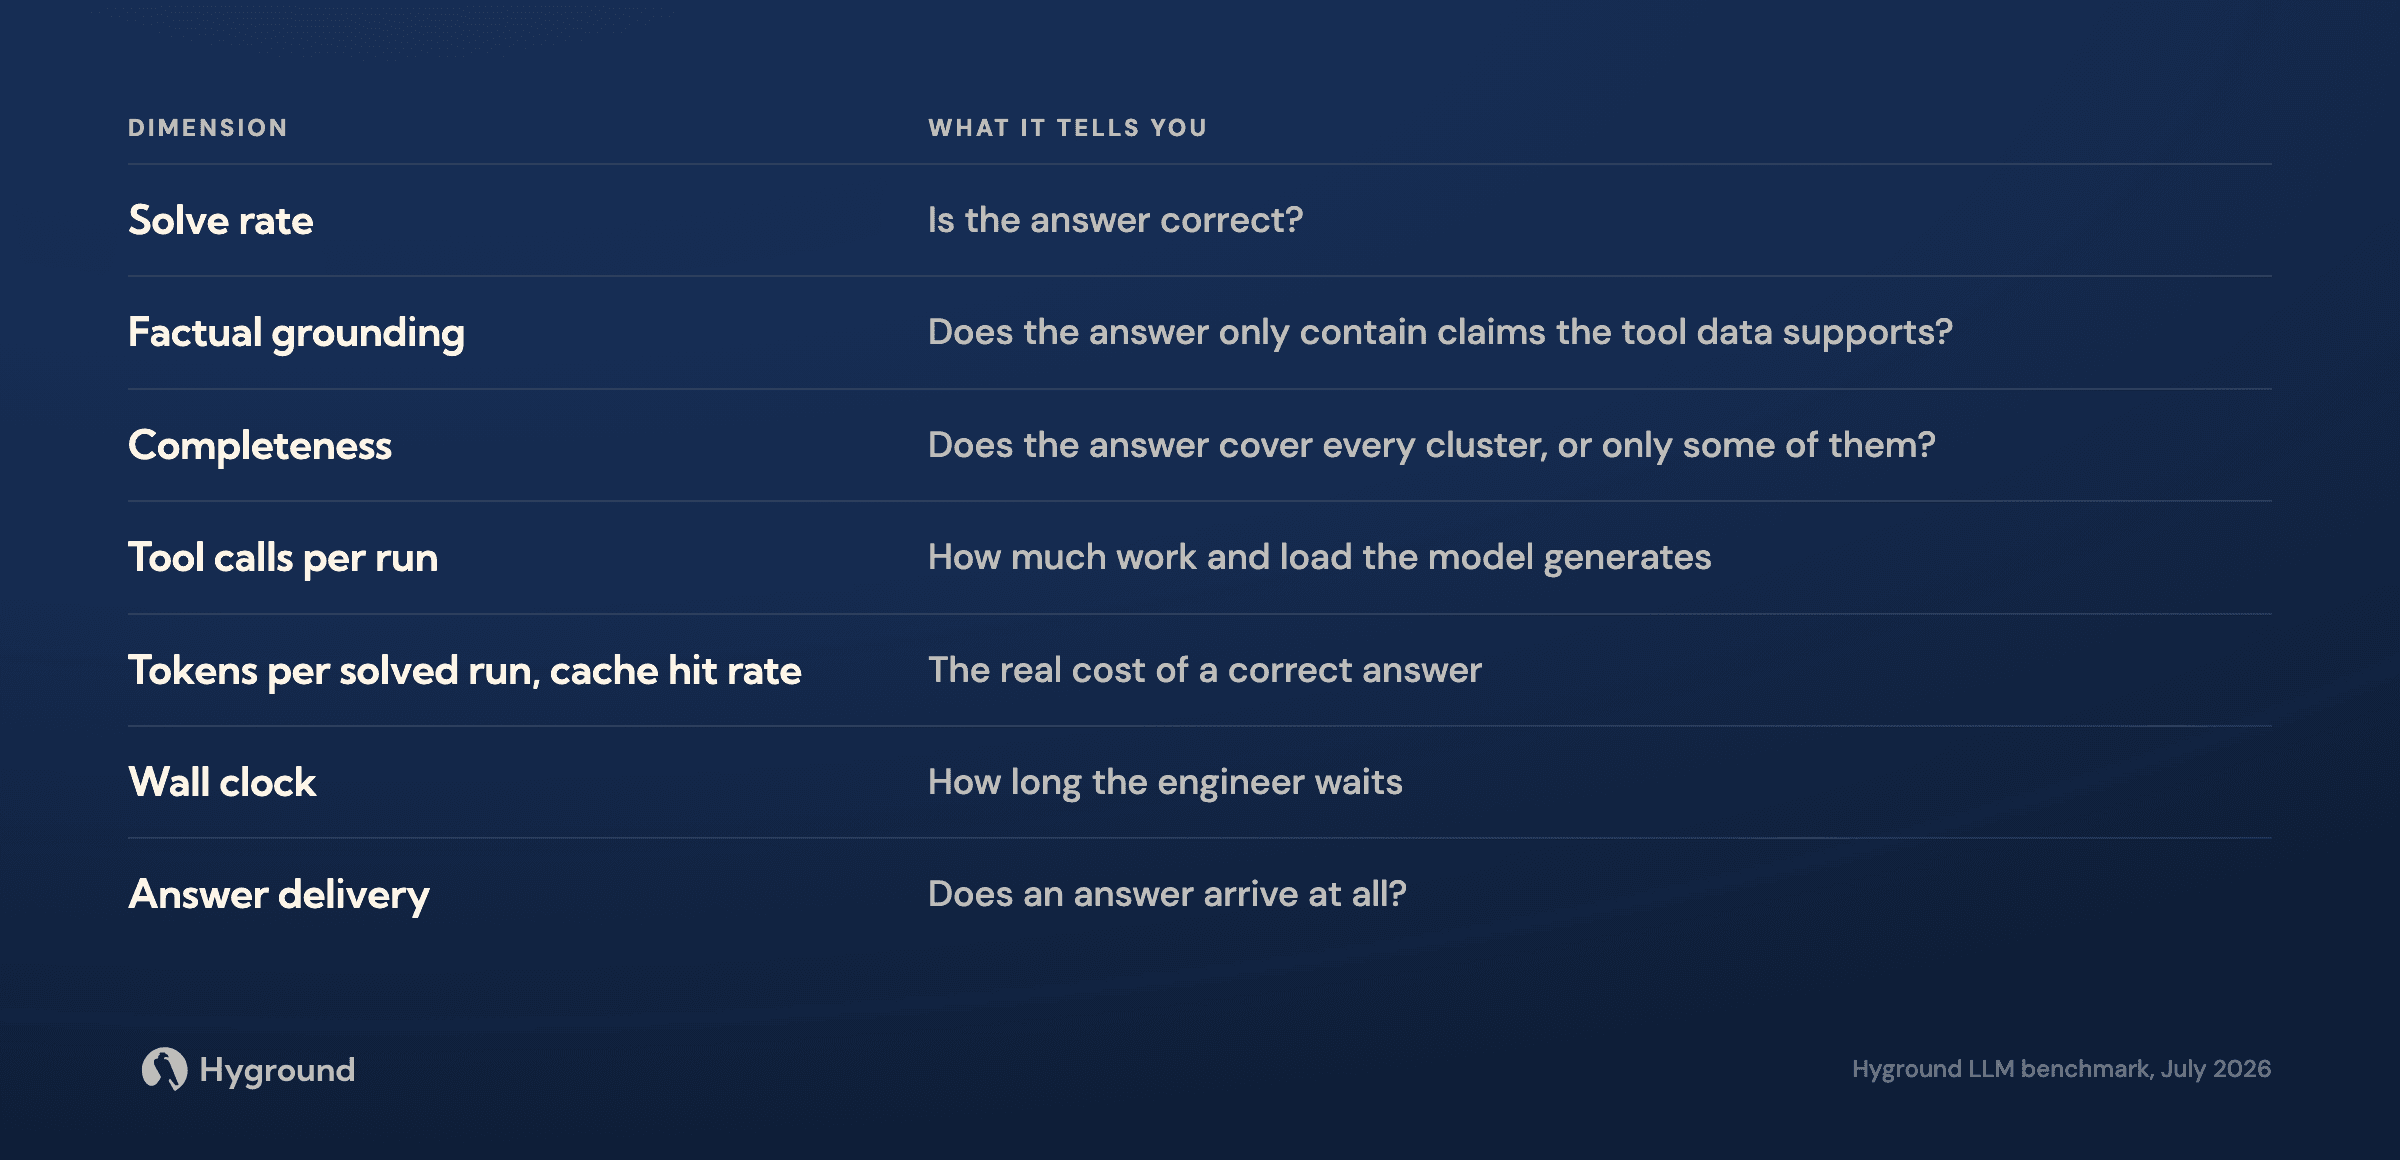
The seven dimensions. A single score would hide the interesting parts, so each run was scored on seven metrics:
Finding 1: the top models are almost equally correct
Five of the eight models that ran the full ladder solved 95-100% of their runs. At the top of the market, correctness differences have essentially shrunk to noise. Cost and behaviour did not, however.
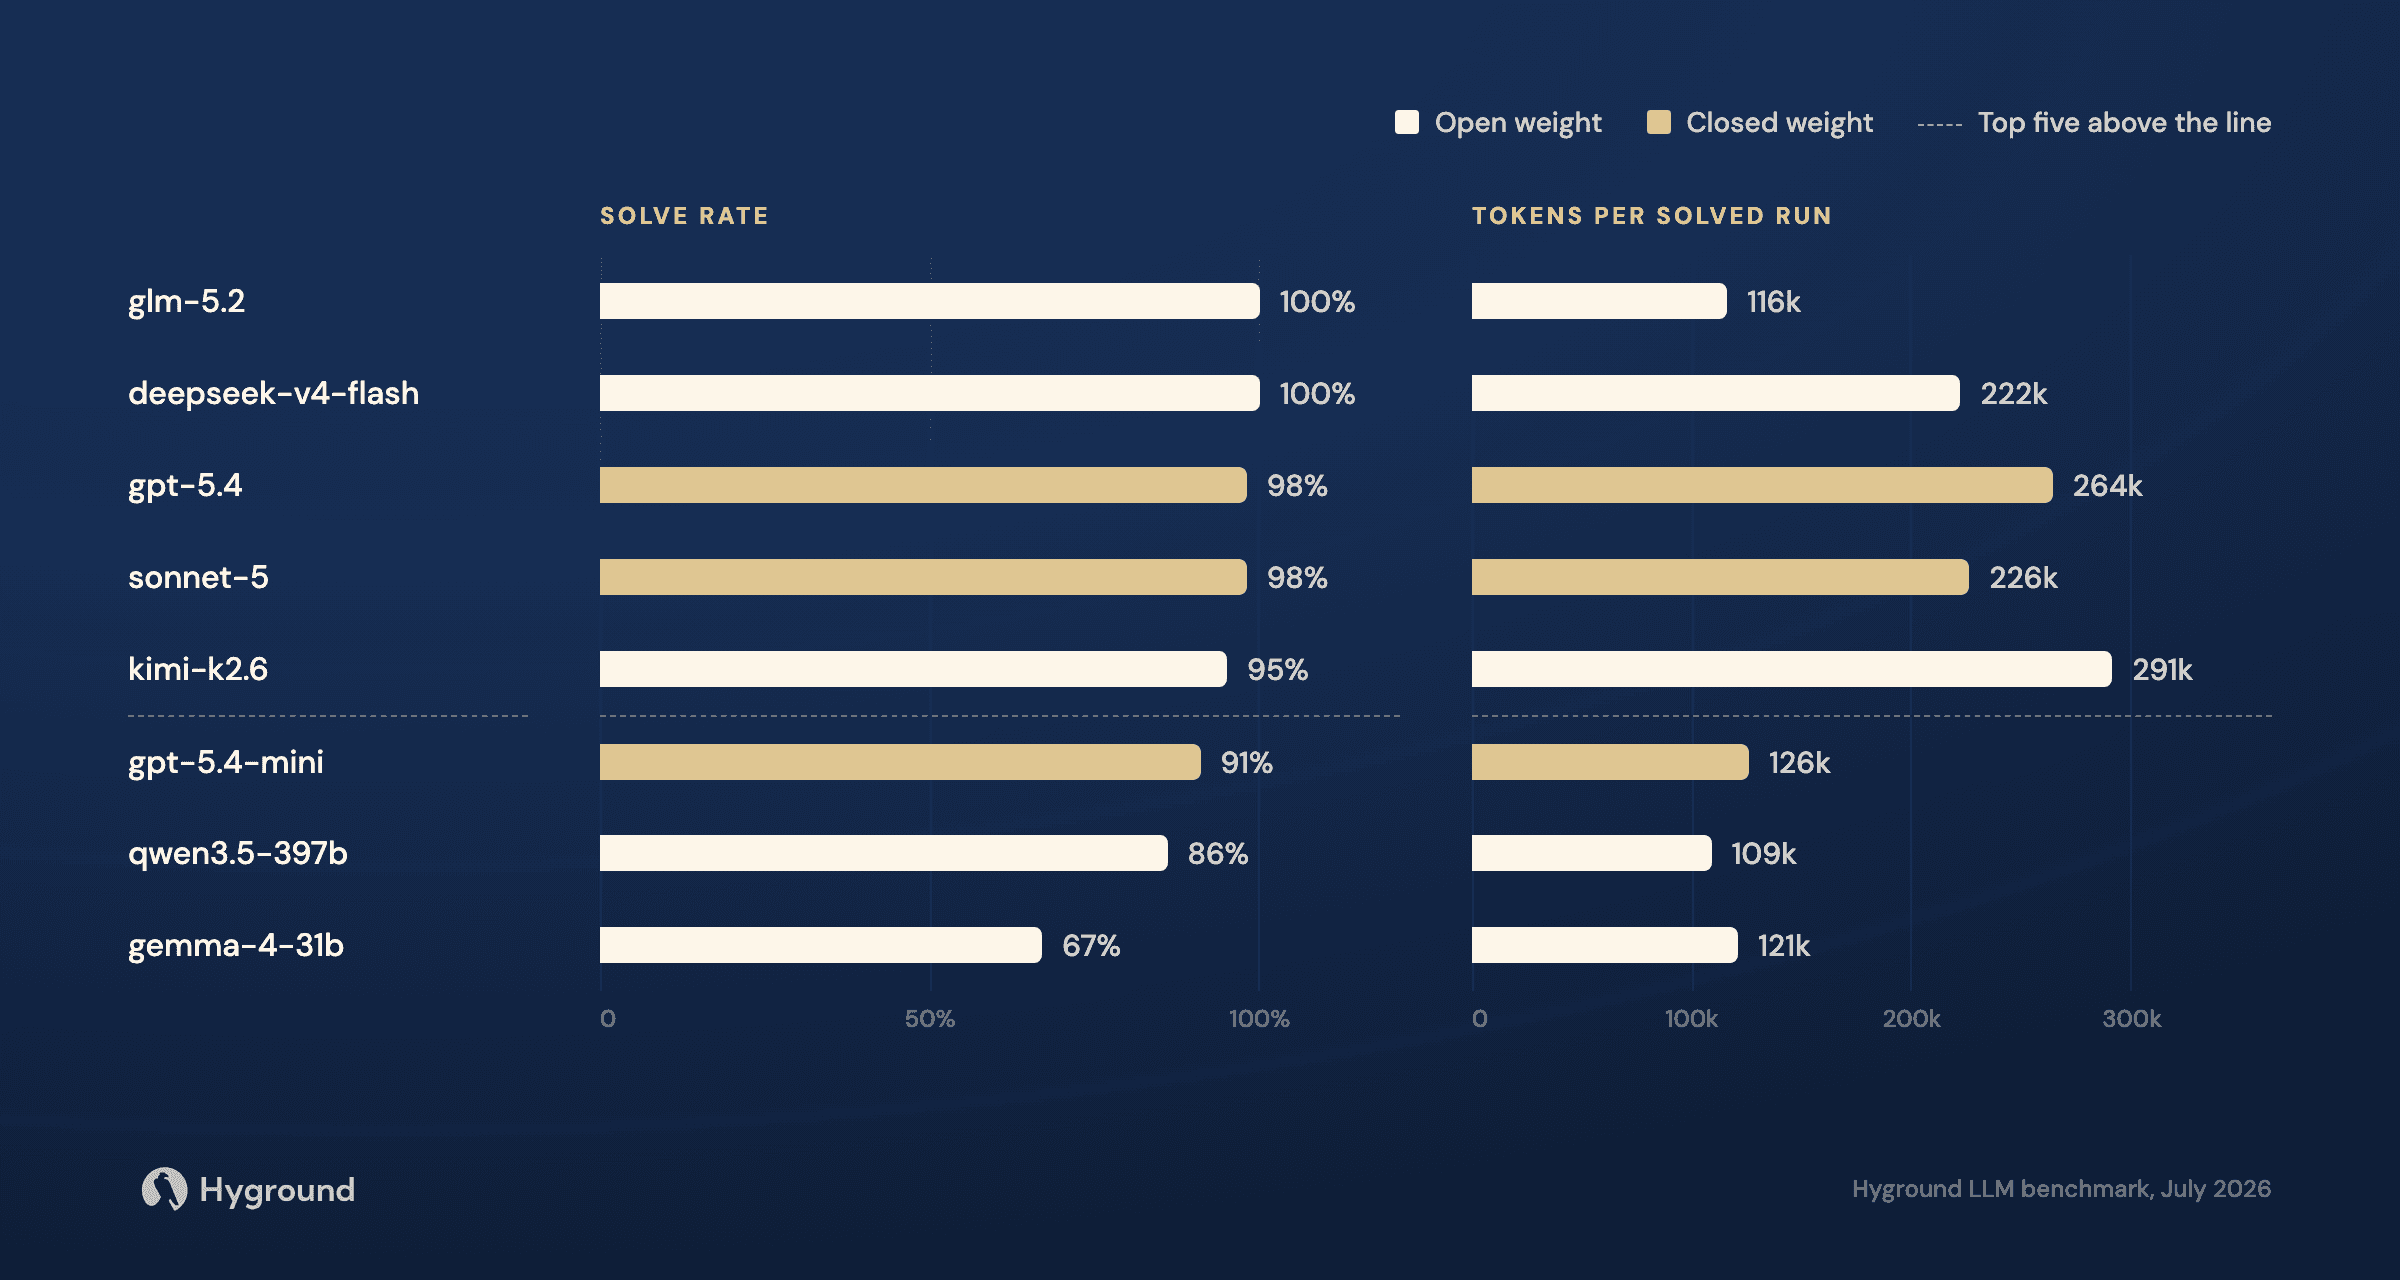
Eight models that ran the full ladder, sorted by solve rate. Five sit within five points of each other on correctness, while their tokens per solved run span 116k to 291k, a 2.5x spread.
Two more models, qwen3-coder and nemotron-3-ultra, never made it onto the ladder. Both emitted malformed tool arguments and then retried the identical broken call, one of them up to 38 times. Respectable benchmark scores on paper, but unusable as agents.
We deliberately left list prices out of the chart above, as they can be misleading in two ways:
Suppose a cheap model lists at a quarter of Sonnet’s input price. An obvious win, until it spends far more tokens reaching the same answer, which lands you at the same cost, but took three times longer to get there. In our runs, Sonnet arrived in a median 65 seconds and 9.3 tool calls; deepseek-v4-flash took 186 seconds and 27.1 calls to reach more or less the same conclusion. What surprised us was how often those wildly different paths ended up converging on the same correct answer.
Among those five, cost per correct answer ranged from 116k tokens for glm-5.2 to 291k for kimi-k2.6, a 2.5x spread within one round. A later round on Azure put gpt-5.6-terra at medium reasoning effort at 448k, with the same 100% solve rate: nearly four times glm-5.2’s 116k.
The second reason the pricing page can be misleading: nearly all the tokens in an agentic run are input tokens, not output. The output is a few paragraphs, but the reasoning and accumulated tool results are enormous and get re-sent on every turn. Output price is what vendors compete on, but input volume is what you end up paying for. That makes prompt caching the variable that affects price the most.
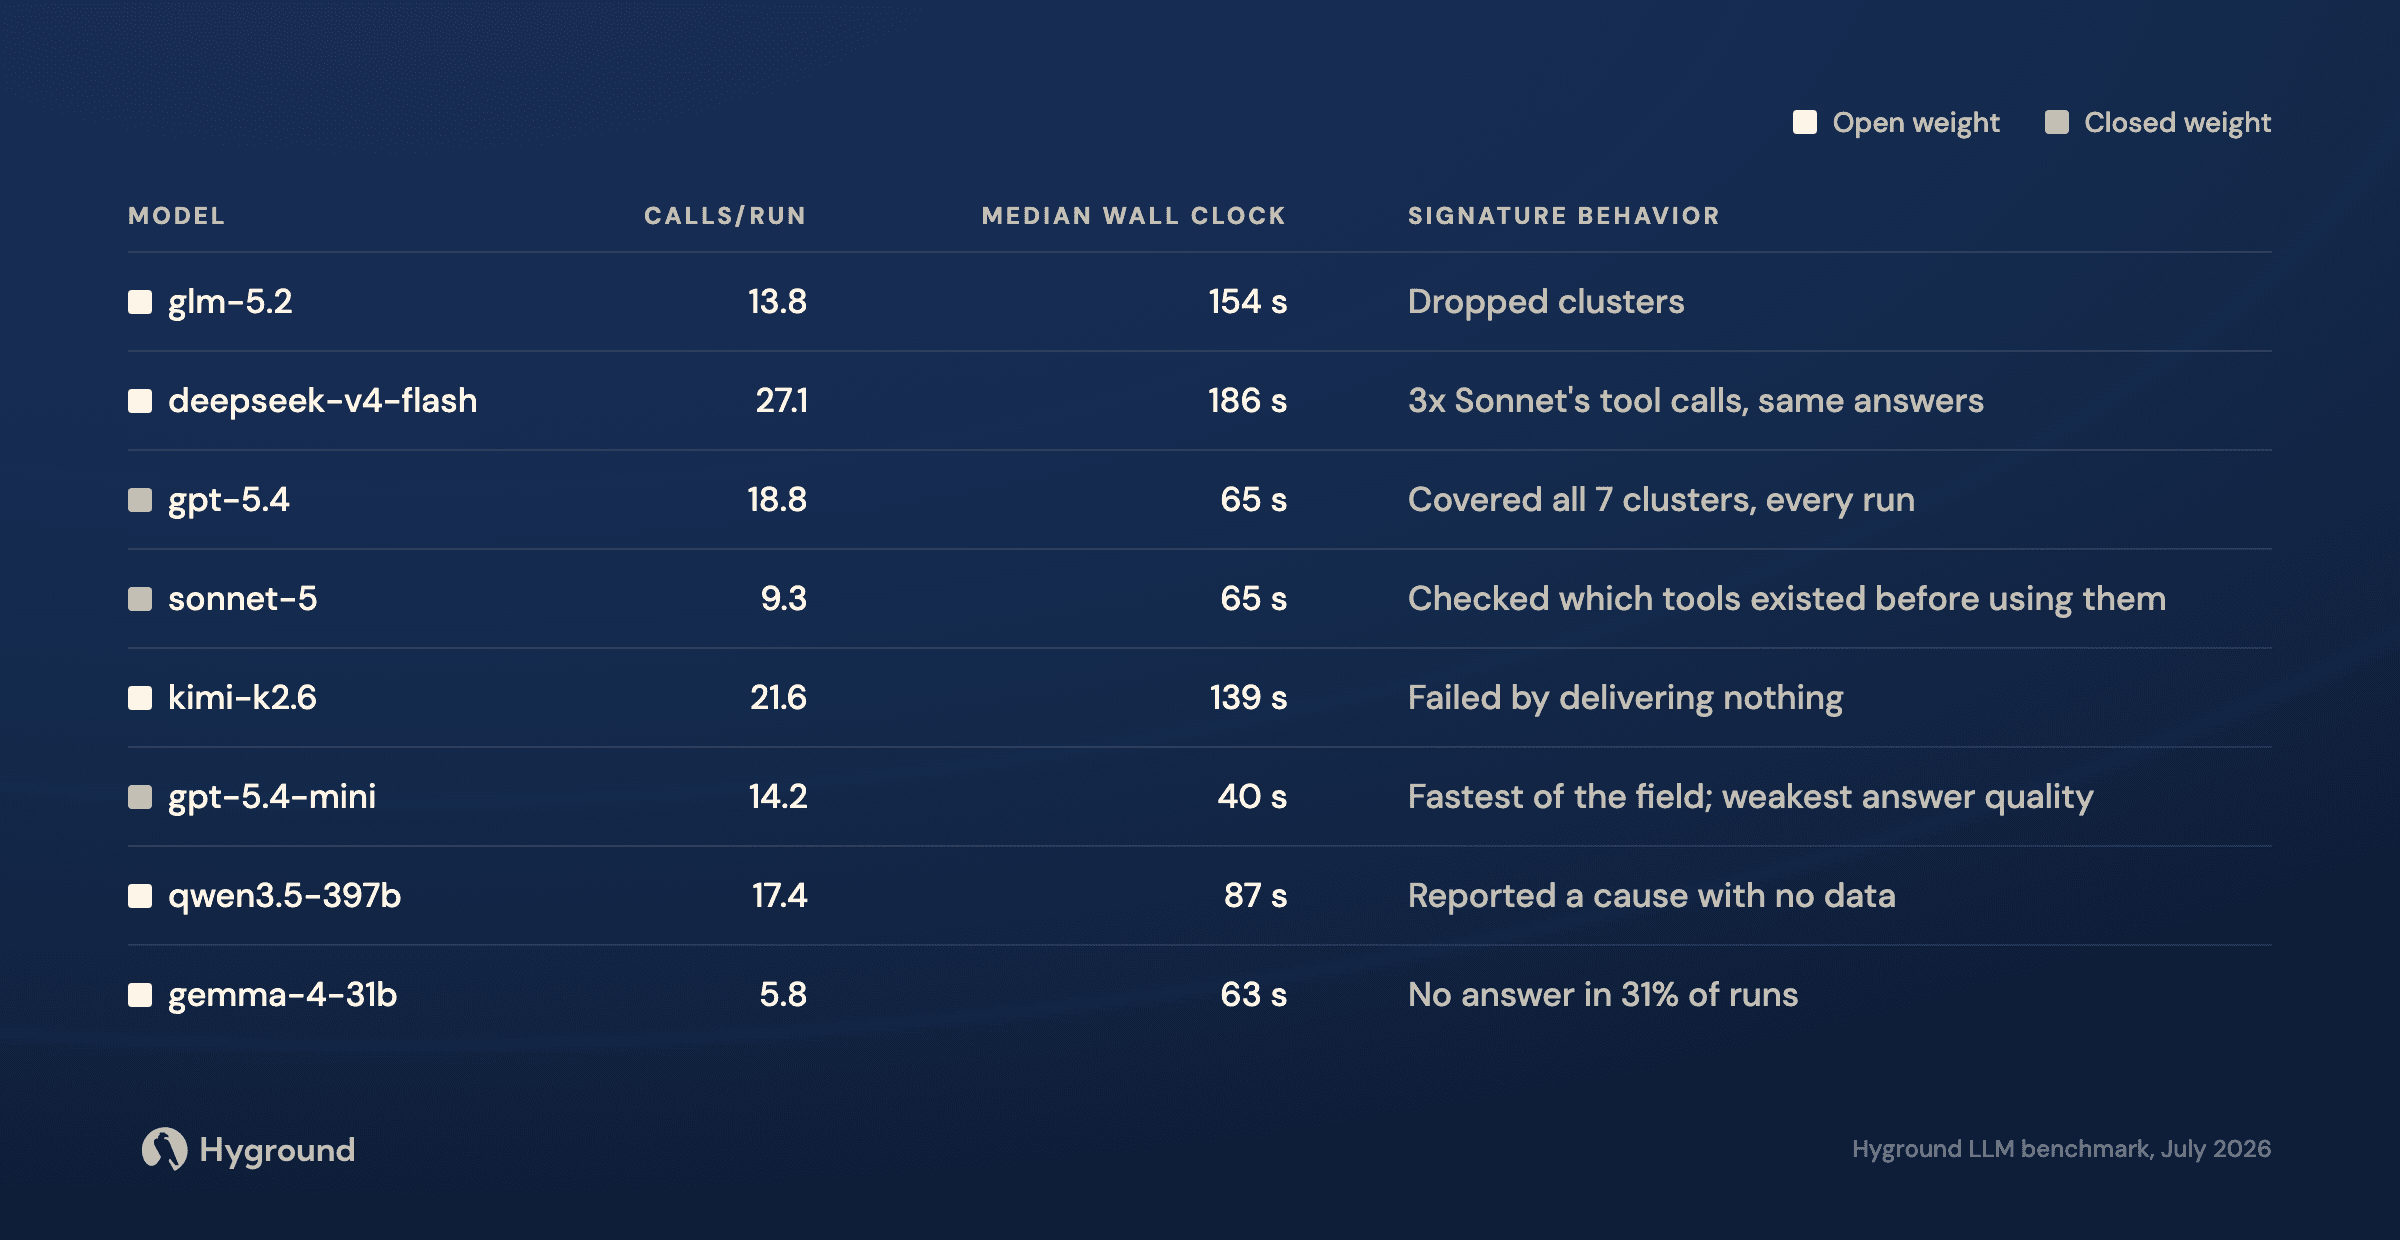
Tool calls, wall clock and characteristic behavior for the same eight models.
If two models tie on solve rate, you still need to look deeper. Price the answer, not the token, and read the failures.
Finding 2: models fail in three different ways
A failure was not limited to just one thing. We found three kinds, and looking at solve rate alone doesn’t surface any of them. A model can top the accuracy table and still fail in a way that renders the model unusable.
The answer is correct but incomplete. glm-5.2 covered all seven clusters in 24 of its 26 cross-cluster answers. Only gpt-5.4 covered all seven every time. The solve rate does not catch this, because an answer that is correct across three or more clusters still scores as solved. Every run had all seven clusters available to it, so this is about how an answer is scored, not about which clusters were in scope. It is why we score completeness as its own dimension, and why you should too.
No answer arrives. gemma-4-31b produced nothing in 31% of runs, and this was also kimi-k2.6’s characteristic failure. From the raw records, this stems from more than one behaviour: some models stopped mid-investigation, some echoed the question back, several hallucinated tool names that were never offered to them, and some generated tokens so slowly that the system hit its timeout before an answer existed.
A cause is reported that the data didn’t support. In the root-cause task, qwen3.5-397b’s tool calls failed and it reported “elevated 5xx due to OOM kills” regardless, with no 5xx evidence anywhere in what it had retrieved, in all three of its runs. It also miscounted resources and reported on checks it never ran.
Kimi K3, tested separately on a European provider, produced zero confirmed fabrications and zero false-success claims across 98 valid runs. The worst model in the set produced them in 16% of runs. A spread far wider than anything we saw in correctness. If you can only measure one thing beyond solve rate, measure this.
This is why the test exists. Every model that invented evidence is directly excluded from the set we recommend to our customers for obvious reasons.
Finding 3: the serving provider changes the model
We pinned identical glm-5.2 weights to five serving providers, which then produced five different results.
One answered in about 2 seconds per call, skipped most of the investigation, and solved a third of its runs.
One reasoned properly and took 82 seconds per call, which no agentic loop survives.
Three were reliable, but still measurably different from each other.
What the provider controls, independently of the model, is speed, quantization, whether reasoning-effort settings work at all, and what happens to your data. Several providers don’t publish their quantization or say whether they support effort levels, so before you can test the model you have to run experiments on the provider just to find out which knobs are actually at your disposal.
Data handling is another problem. The fastest provider in the set retained prompts by default. If you need zero retention, enforce it per request, because the provider’s reputation guarantees nothing.
The failure we didn’t anticipate was capacity. GLM ran well on one European provider and kept working right up until business hours, when it slowed enough to be unusable, not because anything about the model or the configuration changed, but because we were sharing that provider’s capacity with everyone else on the network at that time.
Advertised rate limits don’t help here either: a provider can offer generous tokens-per-minute and still not have the hardware free to deliver them at 10am on a Tuesday. The large clouds mostly let you buy your way out of this; smaller providers often can’t sell you this at any price though.
An independent measurement study of hosted open-weight LLM APIs, When Is the Same Model Not the Same Service?, reached the same structural conclusion from a much larger dataset: the unit you actually operate is not a model but a provider-specific, time-varying endpoint, and listed prices are far more stable across providers than latency, throughput, context length or error behaviour are.
Our internal rule follows: a recommendation for an open-weight model is valid only for a named provider and a named configuration, and it expires when either changes. If you serve the model yourself, you then become the provider. These properties become yours to control, and yours to test.
Finding 4: open weights caught up on capability, not on serving
The top of the solve-rate chart is open weight. glm-5.2 and deepseek-v4-flash solved 100% of corrected runs, kimi-k2.6 solved 95%, and Kimi K3 had the cleanest grounding record in the entire test. The frontier models, sonnet-5 and gpt-5.4, solved 98%. On this workload, for these tasks, the capability argument for closed models has essentially evaporated.
Where open weights still differ is in serving: what a cached token costs you, and how fast tokens come out.
Prompt caching. Cache hit rates varied more inside the open-weight set than between open and closed weights. qwen3.5-397b got essentially none at 5%, and gemma-4-31b 25%, while glm-5.2 reached 79% and kimi-k2.6 71%. The closed-weight models ran 78-89%.
So the best open-weight rate matched gpt-5.4’s. The models that cost you are qwen3.5-397b and gemma-4-31b specifically, not open weights as a group. Since most of an agentic run is re-sent input context, and a cache read costs a fraction of a fresh input token, that spread moves the price significantly. One caveat we can’t resolve: most open-weight models were reached through a router, and a router sits between you and the provider’s cache. How much of each rate belongs to the provider and how much to the routing layer has not been isolated, so read these as measurements of the path we took rather than properties of the models.
Serving speed. The best open-weight stack in the test produced about 2,100 tokens per minute, against roughly 5,000 for sonnet-5. An investigation sonnet-5 finishes in a minute takes closer to three on that stack. Slow enough, and the system hits its timeout before an answer exists, which is the second failure type from Finding 2.
How to test a model for your own agent
The models in this post will be superseded, most within months: new versions of the same families, at new prices, with new serving behaviour. Re-run this method on whatever ships next.
Test the actual job. Your tools, your data, your real questions, run repeatedly. Benchmark standing doesn’t predict agent behavior: qwen3-coder never completed a single run on our ladder.
Automate it, because you’ll run it again. This is the one we’d emphasize most. Model families turn over every few months, providers change the way they serve models without announcing it, so a one-off manual evaluation is quickly useless.
Measure failure types, not just solve rate. Look specifically at runs where tool calls failed, and count the claims with nothing behind them.
Price the answer, not the token cost. Tokens per solved run against cache hit rate. The pricing on a website doesn’t predict your final cost.
Test per provider and configuration. For open weights, you’re testing the serving stack as much as the model itself. Re-test when it changes, and check performance during your own business hours.
Check completeness explicitly. An answer that came from only four of your seven clusters looks fine at first, but is essentially worthless in the long run.